Friday 30 December 2016

PORTER'S FIVE FORCES MODEL


Definition: Porter’s five forces model, refers to a framework based on the competitive analysis, introduced by Harvard Business School Prof. Michael E. Porter. The model determines the intensity of competition in any industry is a mix of five competitive factors operating in different areas of the whole market.

The framework is an outside-in strategy tool for the business unit that evaluates the attractiveness (profitability) of an industry. Thus, helps the business-persons to identify existing and potential lines of business.

It is a useful tool for accurately diagnosing important competitive elements in the market, as well as determining the strength and significance of each five forces.


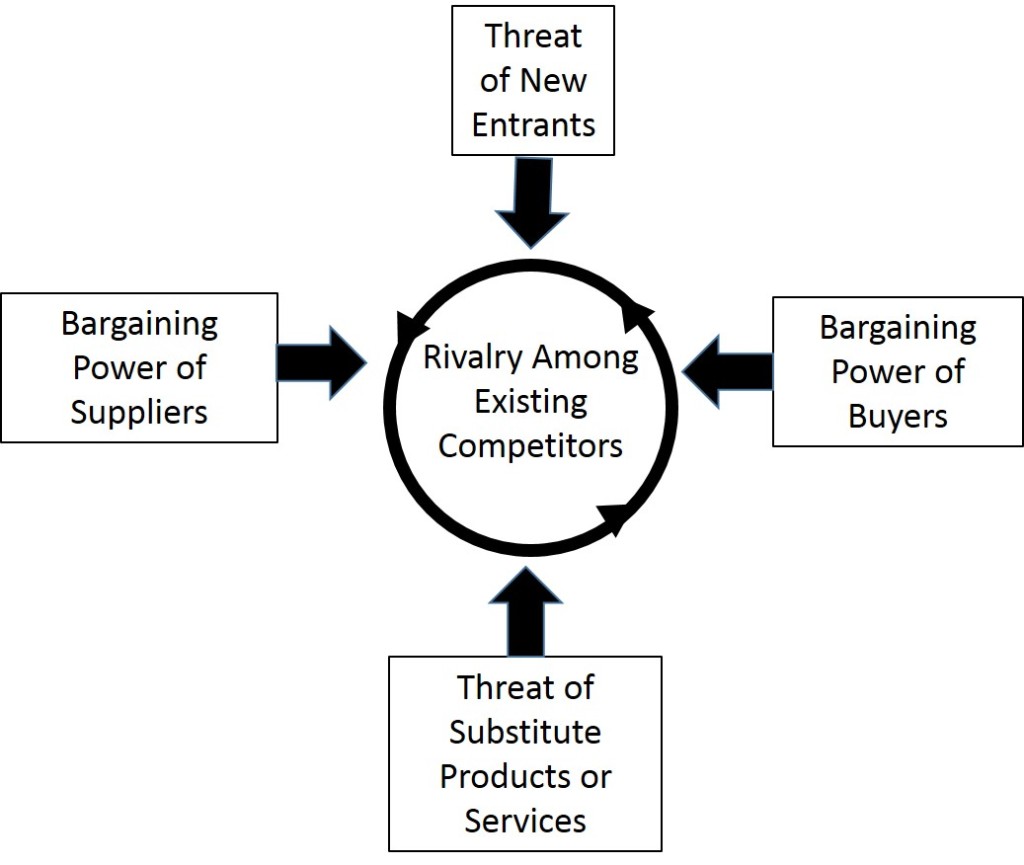
Threat Of New Entrants: Potential entrant is the major source of competition in the industry. The product range, quality, capacity, etc. brought by them, increases competition. The size of the new entrant plays a major role here, i.e. the bigger the entrant, the more intense is the competition. Moreover, the prices are slashed, and the overall profitability of existing players is also affected, by the new entry.
It analyses the ease of entry to the new market, i.e. if the entry is easy, then the level of competition in the industry is severe.

Bargaining Power Of Suppliers: Suppliers, also exert substantial bargaining power over the firms, by threatening to increase prices or degrade quality. They are likely to exercise power if:
§        The number of suppliers in the industry is limited in number.
§       They offer the specialized product.
§       The supplier’s product is an important input, to the buyer’s product.
§       The product has a few substitutes.
Thus, the factor analyses bargaining power of industry suppliers, which directly affects the profitability, i.e. the higher the cost, the lesser is the profitability.

Bargaining Power Of Customers: The market of outputs, i.e. the customers have the ability to compete with the supplying industry and put the companies under pressure, by forming groups or cartels. This force not only affects the prices but also influences the producer’s cost and investments in certain circumstances, as the powerful buyers influence producers to offer better quality which involves cost and investment.
Buyer groups are likely to exercise power if, they are concentrated, products are homogeneous, the switching cost is low, and full information is available.

Threat From Substitutes: It is the quiescent source of competition, present in the industry. They are the key cause of competition in many industries. Substitute products are offered at reasonable prices along with high quality, to the customers can radically change the competitive scenario of industry, especially, when the introduction is sudden.

Rivalry among current players: Last but not the least, is the rivalry among current players, which is all that is known as competition. It can be shown in a number of ways such as:
§       Price competition
§      Advertising battles
§      New introductions
§      Improving quality
§      Increasing consumer warranties.
So, this factor analyses, how ruthless the competition is, by identifying the existing player and marketing down their moves and activities. The competition is said to be acute when, there are a few sellers, offering similar products to the customers because it is easy for buyers to switch to the one offering product at low prices.
Therefore, the model is all about taking offensive and defensive actions, to create and maintain a competitive position in the market and to cope with the challenges (five forces) successfully.


ACQUISITIONS-MERGERS IN 2016


1. Softbank (Japan) acquired ARM Holdings (Britain)
 CEO of Softbank is Simon Segars
 (ARM Holdings plc is a multinational semiconductor and software design company)
SoftBank Group Corp. is a Japanese multinational telecommunications and Internet corporation established on September 3, 1981, and headquartered in Tokyo, Japan.
CEO: Masayoshi Son (Feb 1986)
Founder: Masayoshi Son
Former CEO: Nikesh Arora resigned from this post in june 2016

2. Microsoft acquired LinkedIn
3. Marriott International acquired Starwood
Starwood Hotels and Resorts Worldwide, Inc. is an American hotel and leisure company headquartered in Stamford, Connecticut.
Headquarters: Stamford, Connecticut, United States
CEO: Thomas B. Mangas (Dec 2015–)
Owner: Marriott International
Founder: Barry Sternlicht
Founded: 1980
4. Blackstone acquired 60% Emphasis
The Blackstone Group L.P. is an American multinational private equity, alternative asset management and financial services corporation based in New York City.
5. Myntra acquired Jabong (owned by Global fashion Group)
Flipkart-owned Myntra on Tuesday said it has acquired Jabong from Global Fashion Group, a move that will mark further consolidation in India’s booming e-commerce industry. Myntra, which itself was acquired by Flipkart in 2014 in an estimated Rs 2,000 crore deal, will have access to a combined base of 15 million monthly active users.
6. Bayer Corp merged with Monsanto (Agri sector)
7. Max life merged with HDFC life
8. Aircel Merged with Reliance communication


Wednesday 28 December 2016

MONEY MARKET/CAPITAL MARKET


Money Market: The market where monetary assets such as commercial paper, certificate of deposits, treasury bills, etc. which mature within a year, are traded is called money market. It is the market for short-term funds. No such market exist physically; the transactions are performed over a virtual network, i.e. fax, internet or phone.

Capital Market: The market where medium and long term financial assets are traded is a capital market. It is divided into two types:
   Primary Market: A financial market, wherein the company listed on an exchange, for the first time, issues new security or already listed company brings the fresh issue.
 Secondary Market: Alternately known as Stock market, a secondary market is an organised marketplace, wherein already issued securities are traded between investors, such as individuals, merchant bankers, stock brokers and mutual funds


PRICE ELASTICITY OF DEMAND


Price elasticity of demand (PED) measures the responsiveness of demand after a change in price.

Price elasticity of demand (PED): % change in quantity demand
                                                     % change in price

Price Elastic Demand
Definition: Demand is price elastic if a change in price leads to a bigger % change in demand; therefore the PED will therefore be greater than 1.


Goods which are elastic, tend to have some or all of the following characteristics.
1.      They are luxury goods, e.g. sports cars
2.      They are expensive and a big % of income e.g. sports cars and holidays
3.      Goods with many substitutes and a very competitive market. E.g. if Sainsbury’s put up the price of its bread there are many alternatives, so people would be price sensitive.
4.      Bought frequently
Price Inelastic Demand
These are goods where a change in price leads to a smaller % change in demand; therefore PED <1 e.g. – 0.5


·         Inelastic demand PED <1 – Perfectly inelastic PED =0
Goods which are inelastic tend to have some or all of the following features:
1.      They have few or no close substitutes, e.g. petrol, cigarettes.
2.      They are necessities, e.g. if you have a car, you need to keep buying petrol, even if price of petrol increases
3.      They are addictive, e.g. cigarettes.
4.      They cost a small % of income or are bought infrequently.
·         In the short term demand is usually more inelastic because it takes time to find alternatives
·         If the price of chocolate increased demand would be inelastic because there are no alternatives, however if the price of Mars increased there are close substitutes in the form of other chocolate therefore demand will be more elastic.

Unitary Elastic Demand
Where PED is =1, i.e the change in quantity demanded is in the same proportion as the change in price.


Using Knowledge of Elasticity

1. If demand is inelastic then increasing the price can lead to an increase in revenue. This is why OPEC try to increase the price of oil.
2. If demand is elastic, firms would be unlikely to increase revenue as this could lead to a fall in revenue. Instead they could try advertising to increase brand loyalty and make demand more inelastic
3. Price Discrimination. Some people pay higher prices for tickets for trains because there demand is more inelastic.
4. Tax incidence. If demand is price inelastic, then a higher tax will lead to higher prices for consumers (e.g. tobacco tax). The tax incidence will mainly be borne by consumers. If demand is price elastic, firms will face a bigger burden, and consumers will have a lower tax burden.

BRAND LOYALTY- PATTERNS BY PHILIP KOTLER

Brand loyalty is defined as positive feelings towards a brand and dedication to purchase the same product or service repeatedly now and in the future from the same brand, regardless of a competitor’s actions or changes in the environment.
Benefits:
Brand loyalty has shown to profit firms by saving them a lot of money. Benefits associated with loyal consumers include:
·         Acceptance of product extensions.
·         Defense from competitors cutting of prices.
·         Creating barriers to entry for firms looking to enter the market.
·         Customers willing to pay high prices.
·         Existing customers cost much less to serve.
·         Potential new customers.
Generally speaking, brand loyalty will increase profit over time as firms do not have to spend as much time and money on maintaining relationships or marketing to existing consumers. Loyal long-term customers spend more money with a firm.

 Philip Kotler, again, defines four patterns of behavior regarding brand loyalty
1.     Hard-core Loyals - who buy the brand all the time.
2.     Split Loyals - loyal to two or three brands.
3.     Shifting Loyals - moving from one brand to another.
4.     Switchers - with no loyalty


BLUE OCEAN STRATEGY


Rather than competing within the confines the existing industry or trying to steal customers from rivals in the HBR of October 2004 W.Chan Kim and Renee Mauborgne suggest Blue Ocean Strategy: Developing uncontested market space that makes the competition irrelevant.

According to Kim and Mauborgne, competing in overcrowded industries is no way to sustain high performance. The Opportunity is to create blue oceans of uncontested market space. Ofcourse competition matters. But by focusing on competition and competitive advantage, according to Kim and Mauborgne, schloars, companies and consultant have ignored two very important and far more lucrative – aspects of strategy:

One is to find and develop blue oceans, and the other is to exploit and protect blue oceans. These 
challenges are very different from those to which strategists have devoted most of their attention.
In blue oceans, demand is created rather than fought over. There is ample opportunity for growth that is both profitable and rapid.

There are two ways to create blue oceans:

One is to launch completely new industries, as eBay did with online auctions. It is more common for a blue ocean to be created from within and a red ocean when a company expands the boundaries of an existing industry. Certainly Kim and Mauborge deserve credits for having made the point of the over focus on competitive advantage and also for their beautiful metaphor of the two types of oceans. Hopefully, the authors will provide more specific tools to find, create, develop, exploit and protect blue oceans in their forthcoming book.

Red Ocean Strategy
Blue Ocean Strategy
Compete in existing market space.
Create uncontested market space.
Beat the competition
Makes competition irrelevant
Exploit existing demand
Create and capture new demand
Make the value/cost trade-off
Break the value/cost trade-off
Align the whole system of a company’s activities with its strategic choice of differentiation or low cost.
Align the whole system of a company’s activities in pursuit of differentiation and low cost


SERVQUAL OR GAP MODEL

The SERVQUAL Model is an empiric model by Zeithaml, Parasuraman and Berry to compare service quality performance with customer service quality needs. It is used to do a gap analysis of an organization’s service quality performance against the service quality needs of its customers. That’s why it’s also called the GAP model.
It takes into account the perceptions of customers of the relative importance of service attributes. This allows an organization to prioritize.

There are five core components of service quality:

1. Tangibles – physical facilities, equipment, staff appearance, etc.

2. Reliability – ability to perform service dependably and accurately.

3. Responsiveness – willingness to help and respond to customer need.

4. Assurance – ability of staff to inspire confidence and trust.

5. Empathy – the extent to which caring individualized service is given


SERVQUAL OR GAPS MODEL


The four themes that were identified by the SERVQUAL developers were numbered and labelled as:

1. Consumer expectation – management perception gap (Gap 1): Management may have inaccurate perceptions of what consumers (actually) expect. The reason for this gap is lack of proper market/customer focus. The presence of a marketing department does not automatically guarantee market focus. It requires the appropriate management processes, market analysis tools and attitude.
2. Service quality specification gap (Gap 2): There may be an inability on the part of the management to translate customer expectations into service quality specifications. This gap relates to aspects of service design.
3. Service delivery gap (Gap 3): Guidelines for service delivery do not guarantee high-quality service delivery or performance. There are several reasons for this. These include: lack of sufficient support for the frontline staff, process problems, or frontline/contact staff performance variability.
4. External communication gap (Gap 4): Consumer expectations are fashioned by the external communications of an organization. A realistic expectation will normally promote a more positive perception of service quality. A service organization must ensure that its marketing and promotion material accurately describes the service offering and the way it is delivered
5. These four gaps cause a fifth gap (Gap 5), which is the difference between customer expectations and perceptions of the service actually received Perceived quality of service depends on the size and direction of Gap 5, which in turn depends on the nature of the gaps associated with marketing, design and delivery of services.So,Gap 5 is the product of gaps 1, 2, 3 and 4. If these four gaps, all of which are located below the line that separates the customer from the company, are closed then gap 5 will close.